I spend a lot of time as a data scientist thinking about how to use data responsibly, particularly when it comes to privacy. There’s tremendous value to be found by analyzing data, but the only way the data science field will continue to have data to analyze is if we are responsible in how we use it.
As a company, Basecamp strives to have the respect for user privacy that we’d like in every service we personally use.
I could talk about the things that we do relating to privacy:
We have a plain English privacy policy, and expect to be GDPR compliant by the deadline.
We use encryption for all communications between Basecamp and your browser, and we encrypt our backend services as much as is practical.
When you cancel, we delete your account and all your data.
We purge log data and database backups after 30 days.
But I think our privacy philosophy is better defined by the things that we don’t do.
We don’t access customer accounts unless they ask.
The only time we’ll ever put ourselves into a position to see a customer’s account is if they grant explicit permission to do so as part of a support ticket. We log and audit all such access.
We don’t look at customer identities.
Many companies, especially startups, review every signup manually and reach out to interesting looking customers. I get lots of these emails, and every one leaves me unsettled.
Tons of companies will also use the fact that you signed up as permission to identify you as a customer for marketing purposes. Over the years, I’ve had to ask no fewer than a dozen companies to remove Basecamp from their marketing material.
I find both of these practices to be distasteful. There’s no reason I, or anyone else here, needs to know the names of people who are signing up for Basecamp. It’s unnecessary.
We don’t share customer data.
There are a few aspects to this, but our basic premise is that it’s your data, and not ours, so we shouldn’t be sharing it.
We get lots of people writing us from big companies asking “does anyone else at Acme use Basecamp?” or people asking “can you tell me any companies in our industry that use Basecamp?”. Just like we don’t look at identities ourselves, we also don’t disclose them to people who ask.
We’ll only provide customer data to law enforcement agencies in response to court orders. Unless specifically prohibited from doing so, we’ll always inform the customer of the request.
It should go without saying, but we don’t sell customer lists or any other data to anyone.
We don’t look at identifiable usage data.
To make Basecamp better, we do analyze usage patterns, and we have instrumentation to enable us to do that. This inherently requires us to in some form look at what people are doing when they’re using Basecamp.
Where we draw the line is that we never look at identifiable usage data. Any data that we use for analysis is stripped of all customer provided content (titles, message or comment bodies, file names, etc.), leaving only metadata, and it’s blinded to remove identifiable information like user IDs, IP addresses, etc. We try to do these things in such a way that it’s impossible for anyone analyzing data to even accidentally have access to anything identifiable.
This choice to never look at any identifiable data (or even be able to) does place minor constraints on the analyses we can perform, but so what? There’s plenty of value left in what we can do. My job might be a little bit harder, but I’m happy to spend the extra effort to be respectful of customers’ privacy.
We don’t send customer data to third party services.
As much as possible, we avoid the user of third party services that require any customer data to pass through them. There are many cases of such tools capturing too much, and we can’t control what happens with data once it reaches them.
There are a few cases where we do use third party services, which I’m happy to disclose:
We use Amazon Web Services and Google Cloud Platform to host some parts of our applications. In those cases, we use available encryption options to prevent the platform provider from having access to the underlying customer data.
We use third party analytics tools (currently Google Analytics and Clicky) on public facing websites only. They capture IP addresses, etc., but are not put in any place where they could capture user provided content.
We use a third party helpdesk tool for answering support cases (HelpScout). This mean that HelpScout has any data that gets sent in a support ticket.
We use third party tools for sending some emails (MailChimp and Customer.io), which have access to customer email addresses and metadata required to know when to send an email. We don’t send any customer provided data to either service.
We use third party CDNs (Akamai and Cloudfront) for serving static assets. Those services have access to IP addresses, etc.
We don’t want you to feel creeped out.
At the end of the day, this is the bottom line. We don’t want to do anything that feels creepy or that we wouldn’t want done with our data.
We know that you’re putting your trust in us when you use Basecamp, and we want to do everything we can to honor and live up to that trust.
A few of us at Basecamp were recently discussing how decisions get made to “green light” new projects, and I came to the conclusion that it boils down a simple rule:
If you can make a decision and you don’t think it’s going to get you fired, just do it.
Basecamp operates without much in the way of formal decision making processes. We don’t have a budgeting process, we don’t have program reviews, we don’t have long term detailed plans. There’s a vision for where we want the company and the product to be going, and a tremendous amount of trust that people will use their time and energy to move us in that direction.
The lack of those formal processes means it’s up to each individual to figure out what to do when they have an idea. The amount of implicit “decision making authority” differs for each person, depending on role, tenure, etc., but the same basic rule-of-thumb applies: if you aren’t worried that making the decision is going to be disastrous, you have authority to make it.
This works out because any decision you make is likely to fall into one of three categories:
You made the “right” decision and the company benefited, hurray! This represents the vast majority of decisions that are made at Basecamp, because we hire intelligent people and those people are making these decisions.
You made the “wrong” decision and nothing bad happened. No problem: as long as we learned something in the process, even a “wrong” decision is often worth the experience.
You made the “wrong” decision and something bad did happen. This is going to be ok too — at our scale, it’s hard for any one decision to be truly disastrous. We don’t have “bet the company” level decisions come up very often.
Our system of granting decision making authority — in which we don’t explicitly grant decision making authority, but let each person assert the level of decision making authority they’re comfortable with — is built on a certain level of trust. Jason and David trust that everyone who works here is smart, capable, and looking out for the best interests of the company, our coworkers, and our customers. In exchange, each of us trusts Jason and David that if we’re operating in good faith, we’ll be ok here even if we make a “wrong” decision.
In nearly seven years at Basecamp, I think I can count the number of times I asked Jason or David for “permission” to do something on one hand:
When I wanted to start running our first paid advertising experiments a month after I started working here.
In almost all of those cases, what I really wanted more than permission was advice. Does the way I’m thinking about this problem make sense? Is this course of action one that you think is likely to succeed?
The list of things that I’ve done without permission is much longer: I’ve committed us to tens of thousands of dollars a month in recurring costs to move our data infrastructure to the cloud, invested months of my time in projects that I thought were to the long-term benefit of Basecamp, launched new internal systems, added features to our customer-facing applications, gotten other teams to spend significant time on projects of my creation, and more.
In all of those cases, representing 99% of what I’ve done here, I either wrote up a plan and shared it beforehand, or I just announced what I’d done after it was completed.
This approach to decision making is well articulated by David Marquet in Turn the Ship Around as “Intent-Based Leadership”. Rather than asking for permission to do something, state your intent to do something and let someone object if they have concerns. Most of the time, no one has concerns, because you’re a smart, capable person who is going to make good decisions.
Having worked this way for nearly seven years, I can’t imagine working at a company where I’m asking for permission to do things every hour or every week or every month or even every quarter. Companies that limit decision making authority strictly do so at their peril — they waste their time worrying about who can make decisions rather than executing on them, and they drive away their best talent. One of our designers tells a story about needing five levels of approval to order a new mouse at a previous job; needless to say, he works at Basecamp now instead of there.
As of this morning at least, following this strategy at Basecamp has worked out for me — I haven’t been fired yet. I also didn’t ask for permission to write this post, and I think it’ll be ok.
Basecamp’s “team data” recently doubled in size with Justin White joining us full-time as a programmer. We’ve been in the data business at Basecamp for over six years, but the occasion of hiring a second team member caused me to reflect on why Team Data exists, what it does, and how we work.
A simple objective: make Basecamp better
We’re basically interested in three things on Team Data:
Make Basecamp-the-product better to help our customers achieve their goals.
Make Basecamp-the-company a great place to work.
Make Basecamp-the-business successful.
These are really the same fundamental objectives every team at Basecamp is working towards, and each team has their own specific angle on this. The support team focuses on how their interactions with customers can achieve these goals, the design and development teams focus on how the functionality of Basecamp itself can achieve these goals, etc.
On the data team, we primarily attempt to use quantitative information to achieve these goals. Our approach isn’t necessarily the best approach for every problem, but it’s the angle we take on things. If we can’t address a specific question or problem with some sort of number, we probably aren’t the best team to answer it, and we’ll gladly defer to the perspective others can bring to bear.
What we do
Pretty much everything we do on Team Data falls into one of two categories:
We answer questions about Basecamp using data and make recommendations. The questions we tackle span a wide range: from specific questions about how a feature is used, to understanding how a change we made impacted signups, to open questions about how we can improve some aspect of business performance.
We build infrastructure and tools to a) support our ability to answer the questions above, and b) help others at Basecamp accomplish their work more effectively.
We occasionally do things that don’t fall into either of those categories, but the core of what we do falls into either analysis or infrastructure.
A sampling of our work over the past few months includes:
Analyzing the performance of a new marketing site and account setup process.
Improving the internal dashboard app that powers many of our internal tools by removing thousands of lines of dead code and upgrading to a modern version of Rails.
Helped design, implement, and analyze a dozen A/B tests.
Migrating our data infrastructure from on-premise hardware to cloud-based services.
Analyzed the sequencing of notifications sent by Basecamp and recommended ways to adjust timing.
Things we believe about ourselves
Every team at every company has a set of beliefs about how they work, whether they are aware of them, acknowledge them, or codify them. Here on team data, there are a few tenets that we try to embody that we’ve taken the time to write down:
We are scientists. Wherever possible, we apply the scientific method to solving problems, whether through analysis or engineering.
We are objective. There’s no agenda on team data other than seeking the truth; we report the facts whether we like them or not.
We try for simple. We don’t use a machine learning model when a heuristic will do, and we don’t write complicated programs when a simple `awk` one liner will work.
We are rigorous. When a problem demands a nuanced understanding or when data needs to be high quality, we stick to those requirements. We’d rather over-explain a complicated situation than over-simplify it.
We are technology and tool agnostic. Ruby, Go, Scala, R, Python — whatever the best tool for the job is. When possible, we use open-source or third-party tools, but we’ll build what’s needed that isn’t otherwise available.
We collaborate, engaging in peer review of analysis and code.
We don’t hit all of these points on every day, but they’re the aspiration we’re working towards.
How we work
Unlike the core product teams at Basecamp, we don’t explicitly work in six week cycles, and we tend to each have multiple projects under way at any given time. Many of our projects are a couple days or weeks, and some stretch over six months or a year. We might do some instrumentation today and then back burner that for 30 days while we wait for data to collect, or a thorny problem might wait until we figure out how to solve it.
Generally, Justin spends about 80% of his time working on infrastructure and the remainder on analysis, and I spend about 80% of my time on analysis and the remainder on infrastructure. This is mostly about specialization — Justin is a far better programmer than I am, and I have more experience and background with analytics than he has. We don’t hit this split exactly, but it’s our general goal.
We get lots of specific requests from others at Basecamp: questions they’d like answered, tools that would help them do their work, etc., and we also have a long list of bigger projects that we’d like to achieve. We explicitly reserve 20% of our time to devote to responding directly to requests, and we both try to set aside Fridays to do just that.
Anyone can add a request to a todolist in our primary Basecamp project, and we’ll triage it, figure out who is best equipped to fulfill it, and try to answer it. Some requests get fulfilled in 20 minutes; we have other requests that have been around for months. That’s ok — we embrace the constraint of not having unlimited time, and we admit that we can’t answer every question that comes up.
Outside of requests, we collaborate with and lean on lots of other teams at Basecamp. We build some of the tooling that the operations team uses for monitoring and operating our applications, and they provide the baseline infrastructure we build our data systems on. We collaborate with developers and designers to figure out how what data or analysis is helpful as they design and evaluate new features. We work closely with people working on improving basecamp.com and the onboarding experience through A/B testing, providing advice on experimental design, analysis, etc.
One of the most visible things our team does is put out a chart-of-the-day; some piece of what we’re working on, shared daily with the whole company.
Like the rest of Basecamp, we don’t do daily stand-ups or formal status meetings. Justin and I hop on a Google Hangout once a week to review results, help each other get unstuck on problems, and — since Justin is still relatively new to team data — walk through one piece of how our data infrastructure works and discuss areas for improvement each week. Other than that, all of our collaboration happens via Basecamp itself, through pings, messages, comments, etc.
Sound like fun?
Here’s the shameless plug: If you read the above and it sounds like your cup of tea, and you’re a student or aspiring data analyst, I hope you’ll consider joining us this summer as an intern. You’ll work mostly on the analysis side of things: you’ll take requests off our main request list and projects from our backlog, structure the question into something that can be answered quantitatively, figure out what data you need to answer that question, figure out how to get the data, perform analysis, write up results, and make recommendations.
I want to talk about one of the most basic tasks a data analyst will be asked to do on a regular basis: present some data over a period of time.
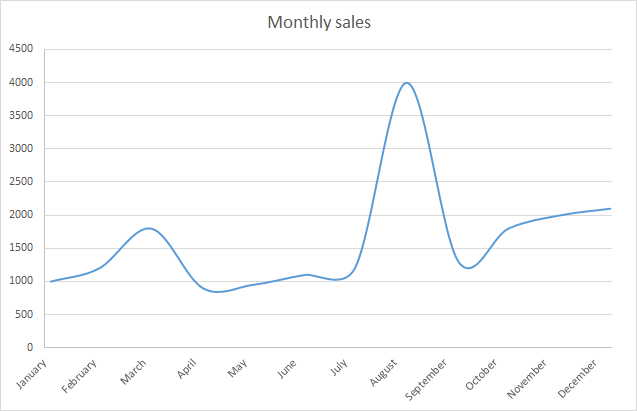
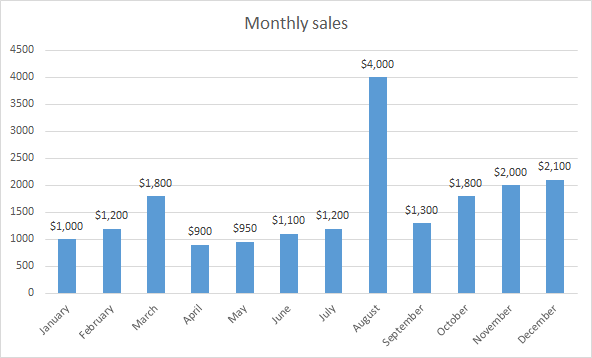
Let’s look at a chart of monthly sales from Noah’s Imaginary Widget Company. I see charts like this on a regular basis:
A basic line chart, right? Nothing fancy or special about it, just a couple clicks in Excel.
Not so simple: this innocent little chart is actually lying to you in a couple of significant ways.
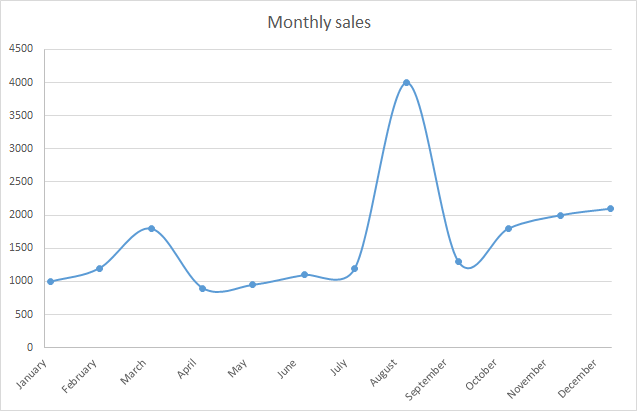
First, you can’t actually tell where the monthly sales values fall —they fall at even points along the width of the chart, but it’s very difficult for you to mentally place the points there. Let’s fix that:
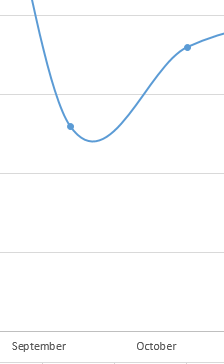
A little better — I can see actual data points now. This chart is still lying to us though. Let’s zoom in on September and October to see why:
The chart makes it look like sales dipped below their September number and then increased to October. This isn’t actually true, or at least we can’t tell from the data we have — we only have monthly numbers, so we can’t possibly have enough information to say that’s what happened in between those two points.
When you use the “smoothed” lines functionality in Excel, Highcharts, D3 or any other visualization tool, you’re asking the tool to lie for you. It’ll happily fit an equation to make things look smooth, but that’s not representing the data. I wish tools didn’t make it so easy to invent data — I can’t think of a legitimate case where you should use an auto smoothing function like this.
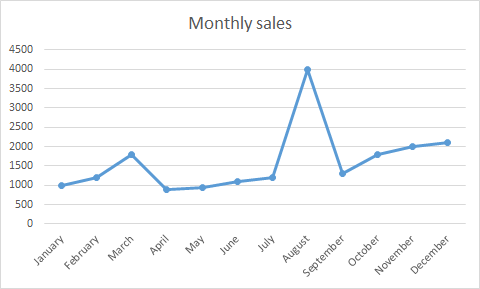
Let’s straighten out those lines:
This is getting better — we no longer imply some perfect mathematical equation that doesn’t exist.
This chart still has a big problem though: by connecting the data points, we imply continuity in the underlying data that doesn’t exist. All we have is monthly data, but when you connect them together, you imply to the viewer that you know what happened in between the points.
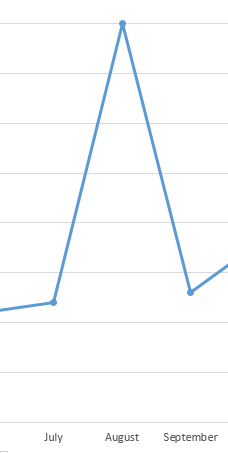
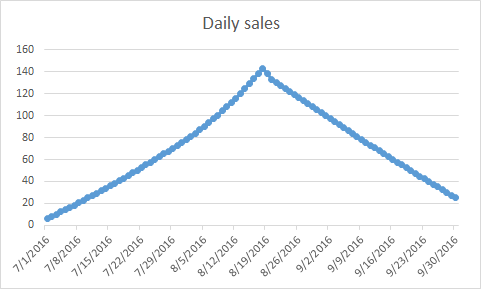
For example, zoom in on July, August, and September. At the monthly level, they look like:
Here’s one set of daily data that could make up this monthly:
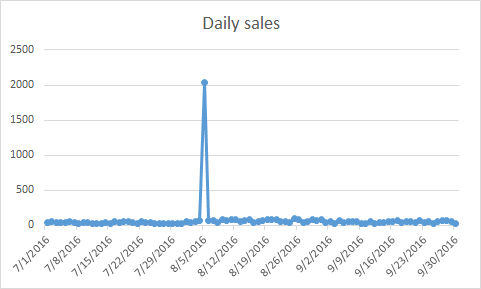
Alternately, here’s a different set of daily data that would get you the same monthly trend:
Connecting the monthly data points together sure makes it seem to the viewer more like the former than the latter, but we don’t actually have enough data to make that conclusion. It could just as easily be the latter case, but you’re unlikely to consider that possibility based on the monthly connected line chart.
The better visualization here is actually to not use a line chart at all. A bar or column chart better conveys discrete quantities like monthly sales: it’s easier to compare relative quantities visually, and it doesn’t imply continuity in the underlying data where there is none.
Much better.
But Noah, aren’t you guilty of using line charts without truly continuous underlying data?
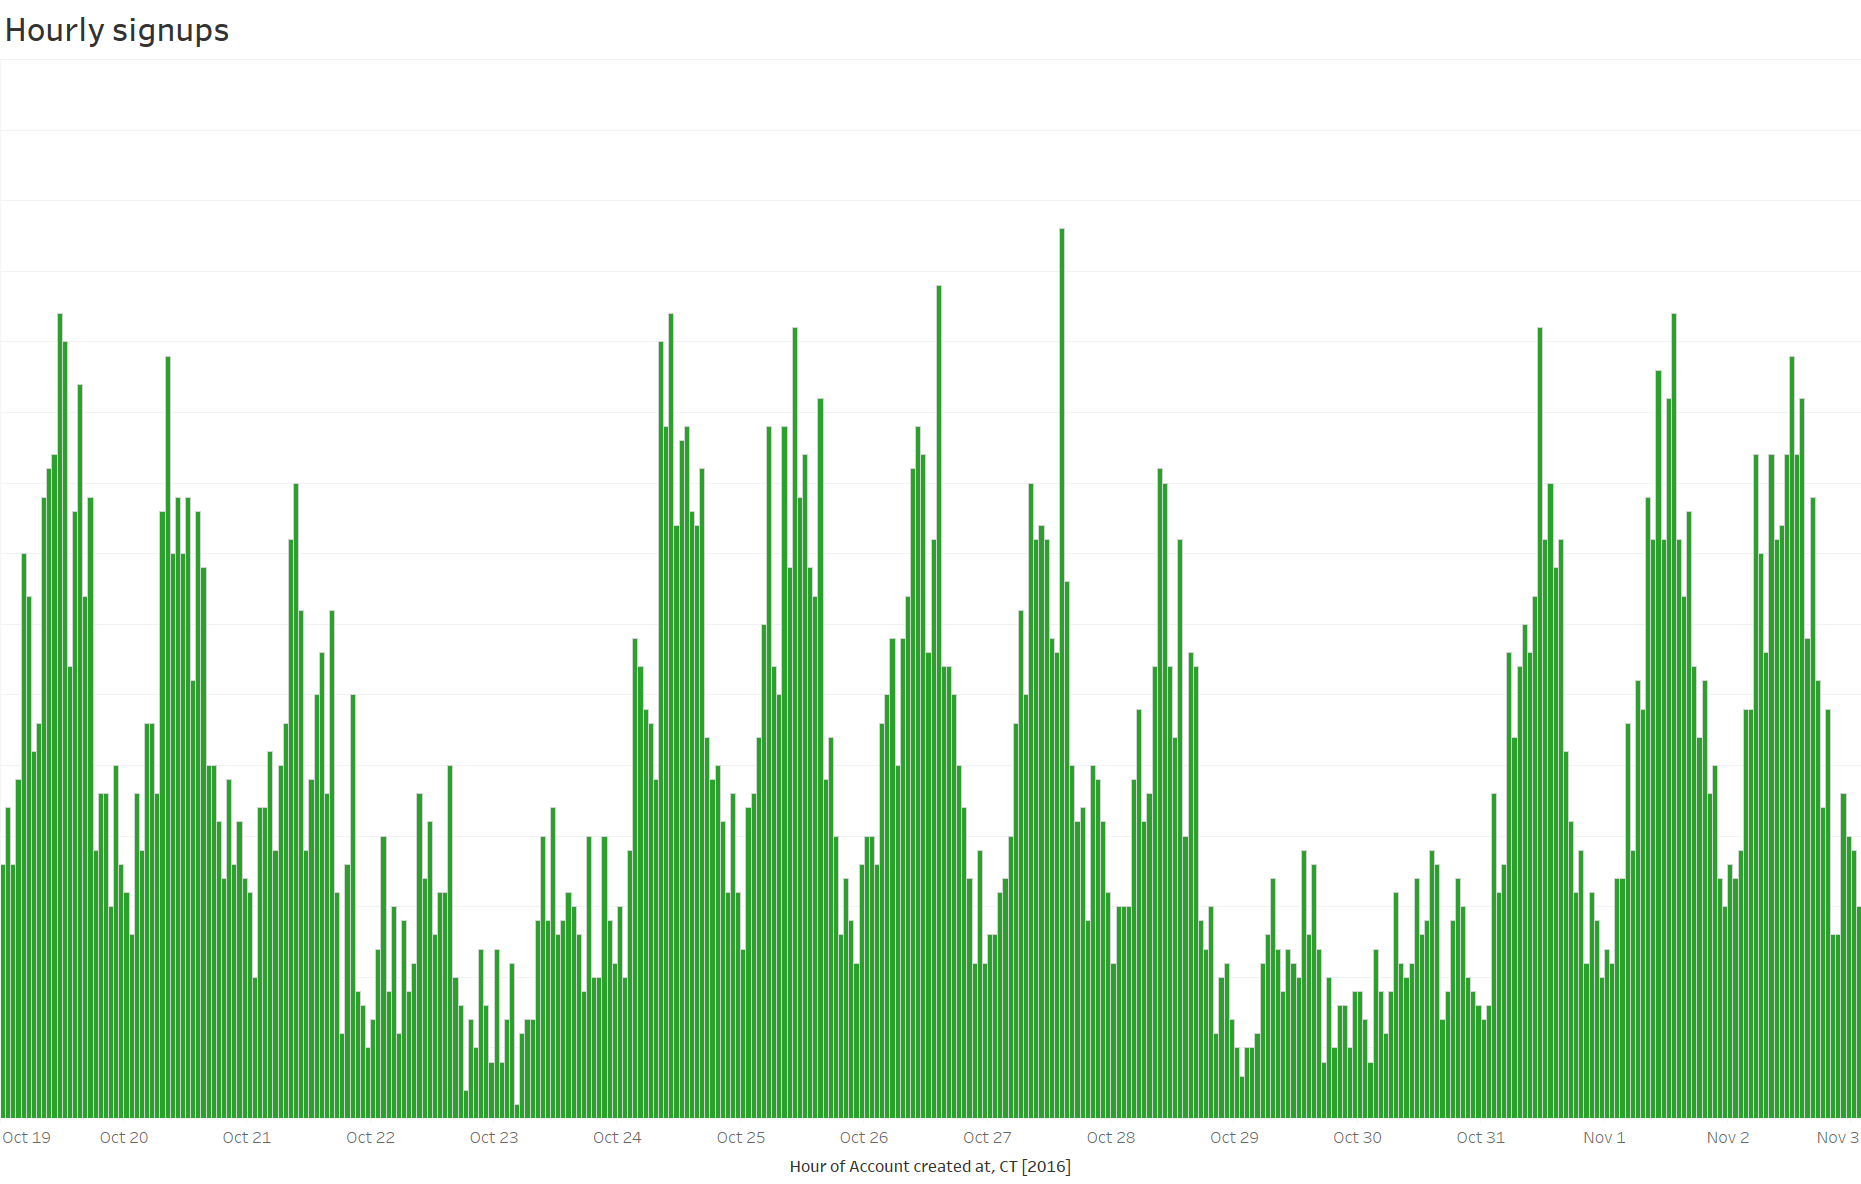
Yep, I am. When you have high frequency data (like if you have once-per-hour data for a few weeks), even though you’re implying some continuity that doesn’t really exist, it can be much easier to comprehend when you do connect the datapoints.
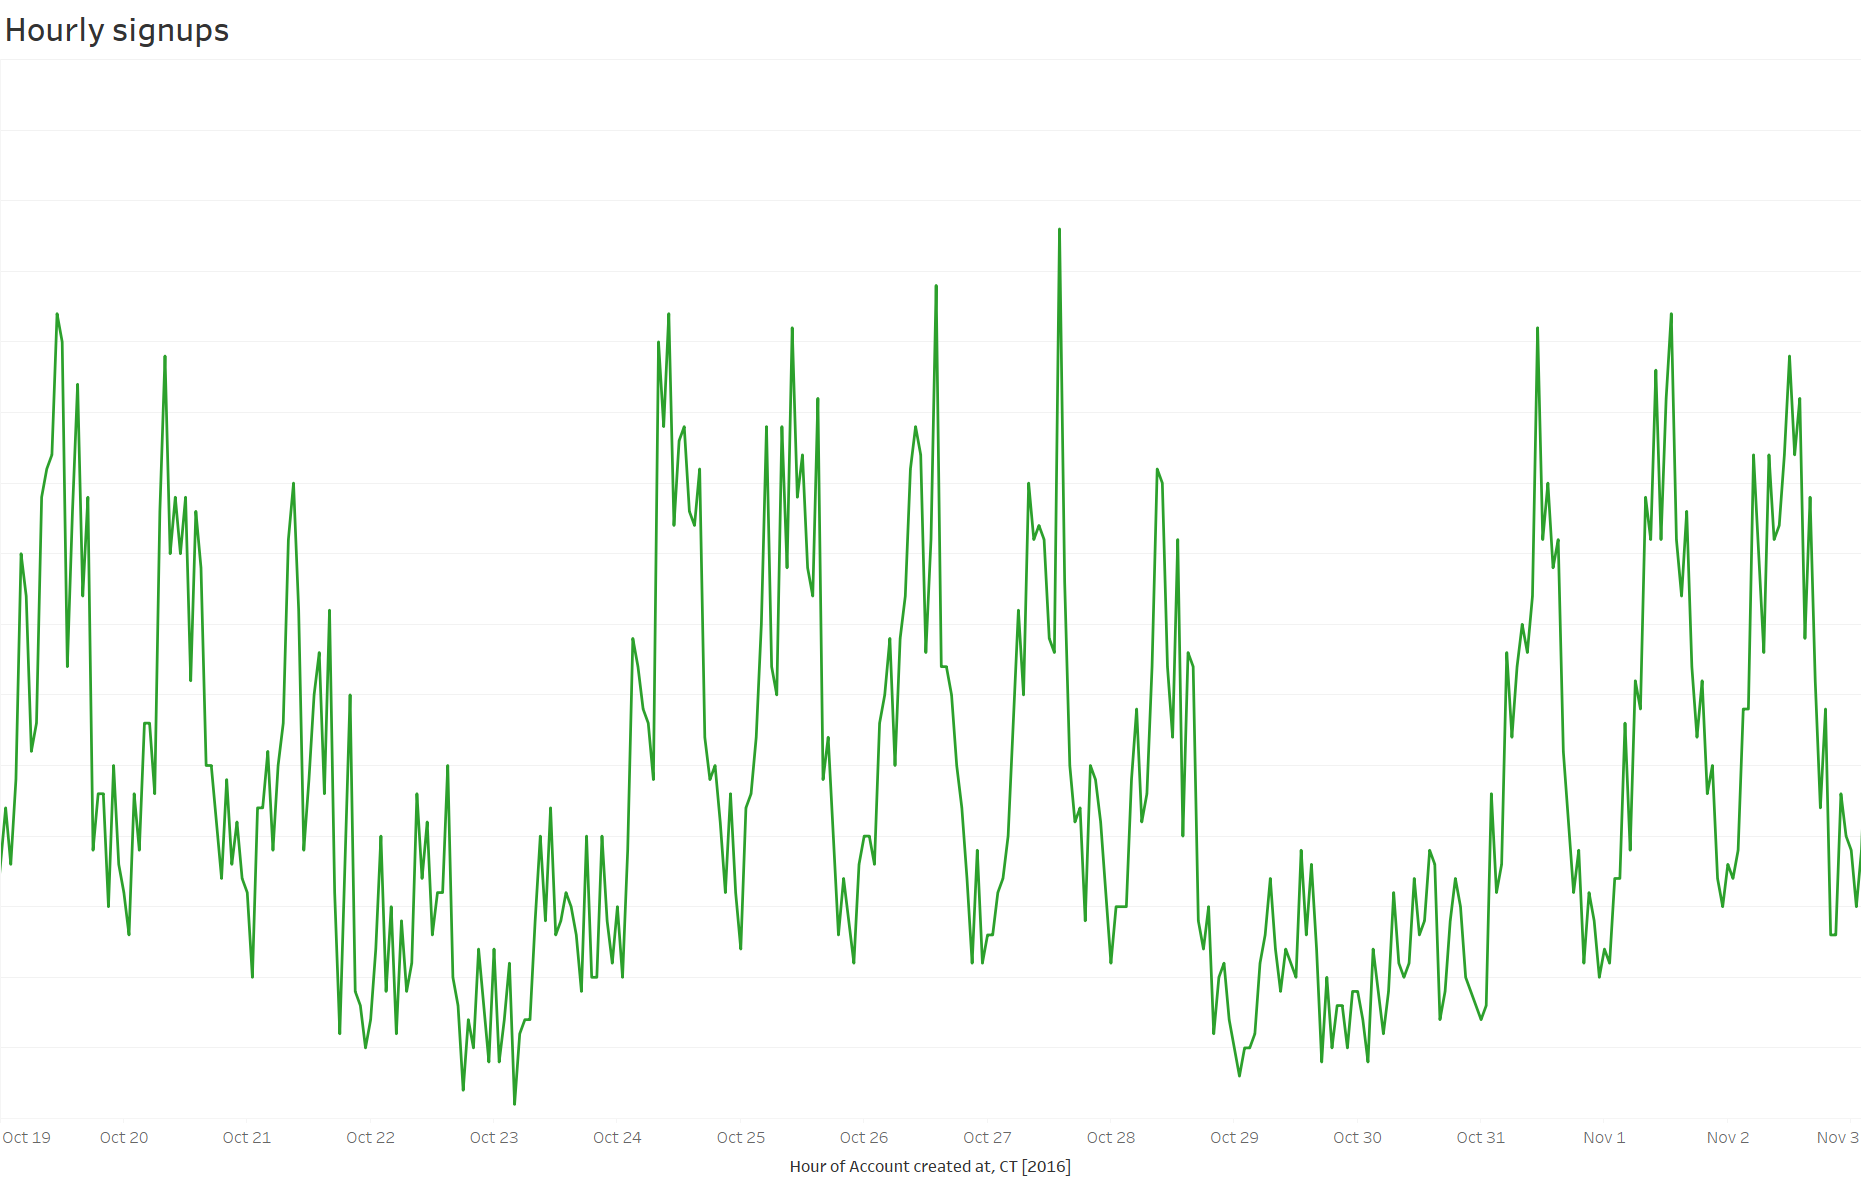
For example, here’s some actual data that meets that criteria: hourly signups for Basecamp over the last two weeks. The bar chart version isn’t bad, but it’s a little hard to grok at first glance, because there’s so much visually going on at that density:
You can probably get a little better by changing the width of the bars, but he equivalent line chart is, at least to me and most people I’ve talked to, a lot easier to comprehend:
So yes, sometimes I deceive with line charts, but it’s a small lie that I can live with.
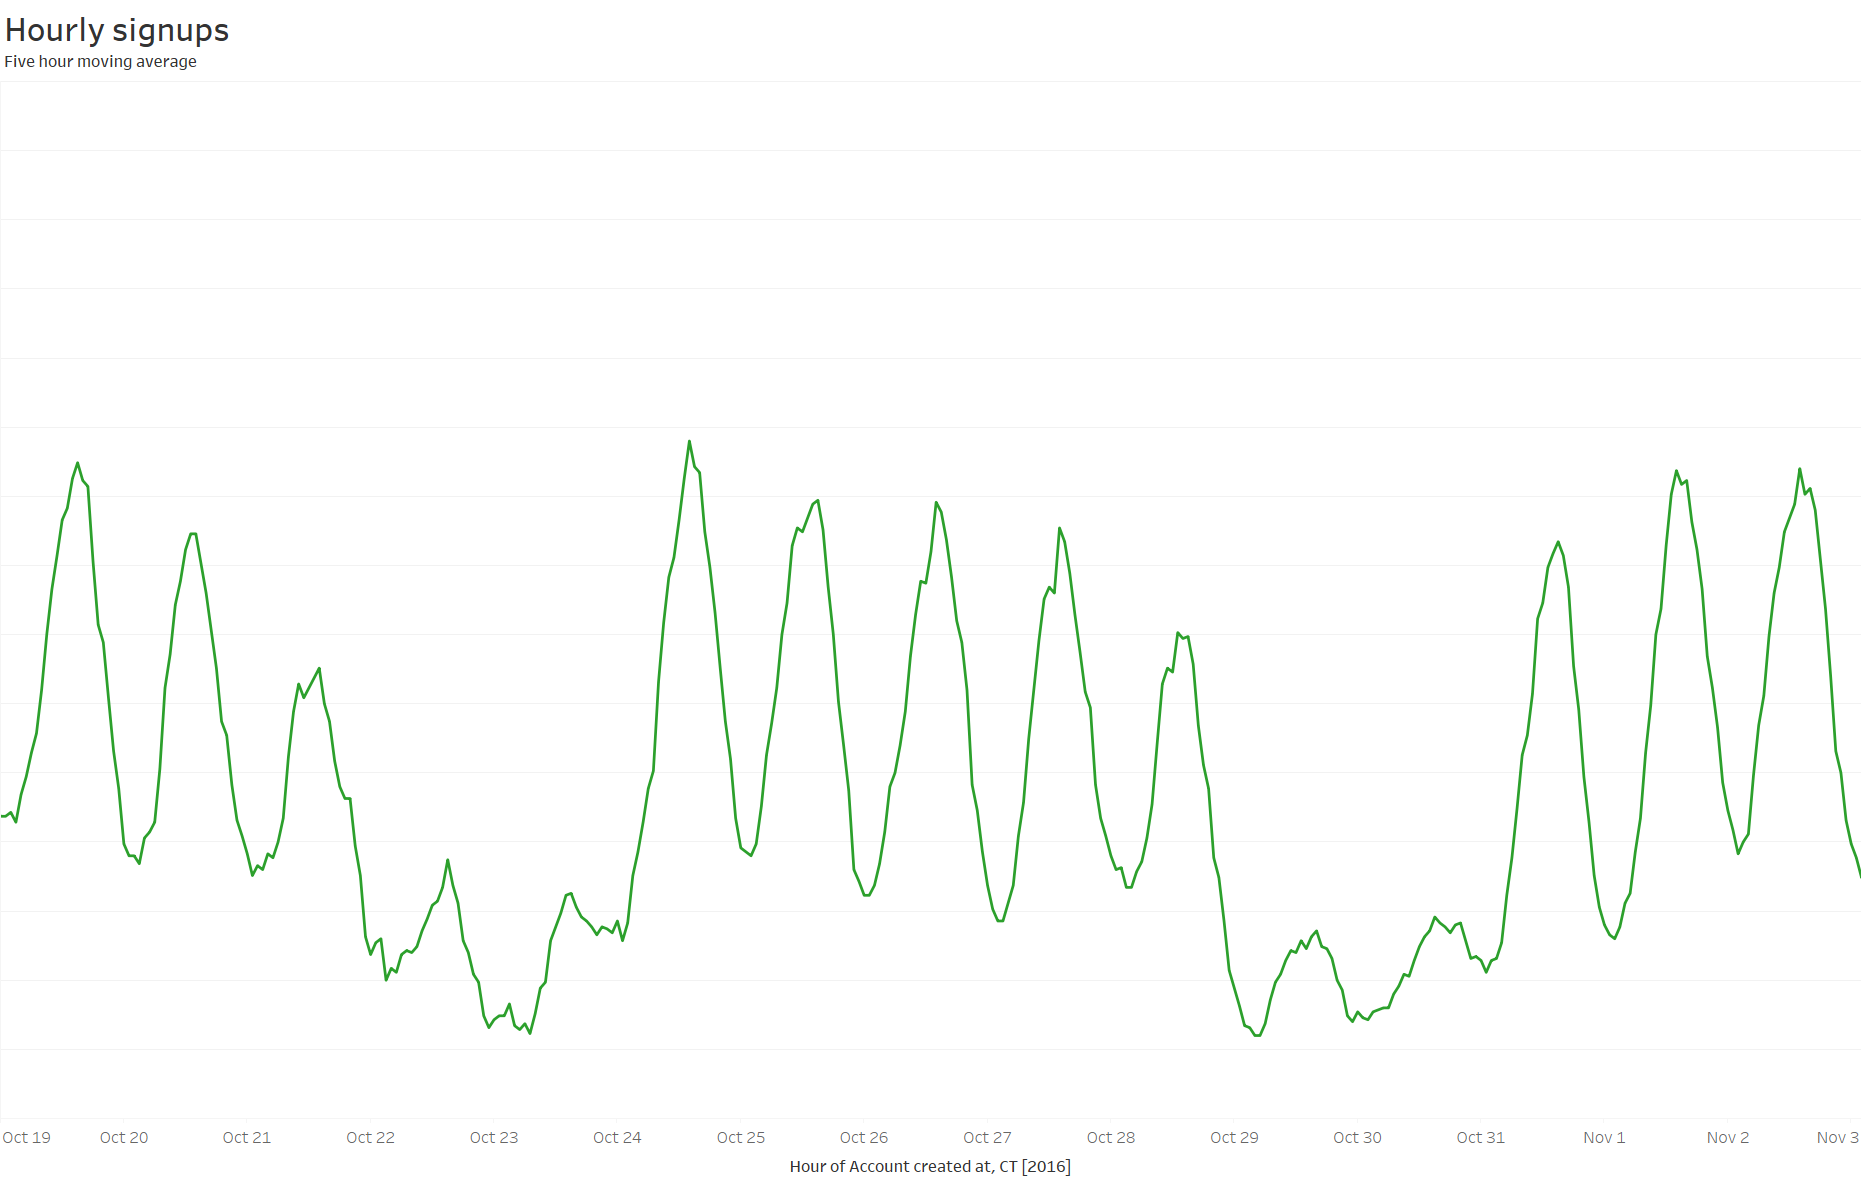
What if I really do want smoothed data?
If you want to show “smoothed” data, that’s ok, but you should explictly decide what sort of transformation you want to apply to “smooth” the data and acknowledge it. Here’s that same signup data with a five hour moving average applied:
About a year ago, I wrote about something I’d recently started doing at Basecamp and a year and over 250 charts later, I’m still at it: every workday, I share a different “chart of the day” with my coworkers at Basecamp.
The charts are just pulled from whatever I’m working on, a question someone asked, or something topical (iOS 10 was released a couple days ago, so yesterday’s chart was about adoption among our users). They can be about anything — marketing, support, operations, performance, usage, the company itself, whatever. I don’t intentionally try to make them extra interesting or visually stunning, and I try to spend no more than ten minutes per day on that day’s chart. I just find a chart and post it in the “Data” project on our Basecamp account.
A few charts from the last year
I had two primary motivations in starting this chart habit:
I wanted to challenge myself to keep things fresh, and to tell stories with data without using more than one chart and a couple sentences.
I wanted to make data more accessible. You shouldn’t have to set aside a half hour to read a report to get a piece of information that can change the way you think.
It’s been a fun challenge to keep this up for over a year, and I’d like to share a few of the things that stand out to me from the last 272 charts.
Maybe they’re a little high in data sugar, but I think they serve a purpose that you don’t get from a dashboard.
Every day is something different. In a year of charting, I’ve never intentionally reused a chart, which means that people have seen over 250 unique slices of data about our business. That’s a breadth that’s hard to achieve any other way.
There’s context. I don’t do a lengthy writeup about each chart, but I write a sentence or two about what the chart shows and why it matters. A chart with no context might just be eye candy, but contextualizing makes it more valuable.
They’re a conversation. I post a chart. People read the chart. Some people applaud it. Some people ask a question that I can try to answer. Some people reference it later. Today’s chart is influenced by yesterday’s chart. Unlike a dashboard or a report, the chart of the day serves as the starting point for a conversation about the challenges we’re facing as a company and the things that people care about.
Making data fun
One of my goals with Chart of the Day is to make working with and thinking about data fun for people. Data isn’t just numbers and long reports; it can also inspire, motivate, intrigue, and make you laugh out loud. While I hope that all of my charts cause joy, there are a couple things that I’ve started doing that are a little more blatant in their aim.
Round numbers
When you do something daily, you’ll inevitably start numbering things, and when you do that, you hit round number milestones, and you’ll be tempted to go a little crazy.
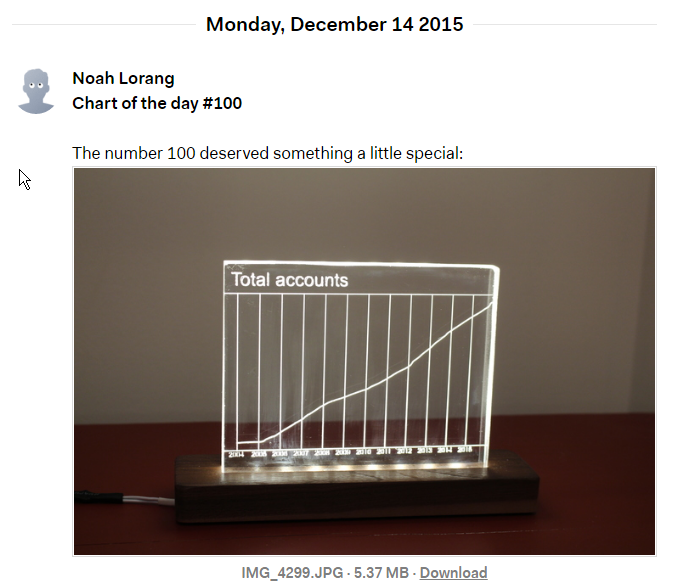
I wanted chart #100 to literally light people up with a look at our growth as company over more than ten years [pun intended].
Chart #100 now resides at Basecamp headquarters in Chicago
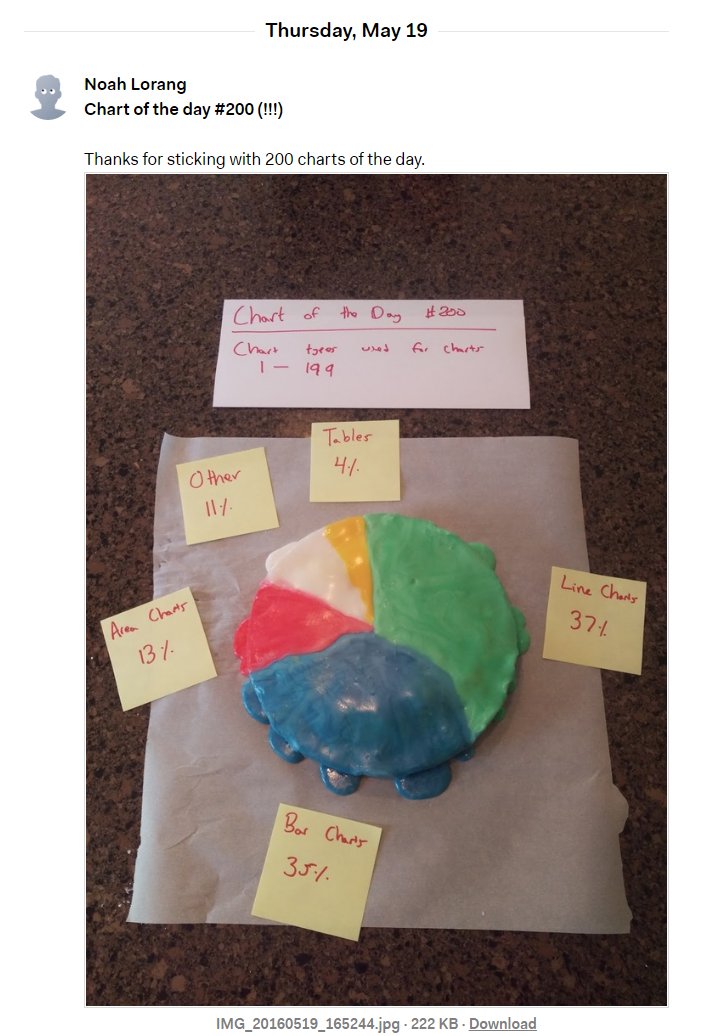
When it came time for chart #200, I was just hungry.
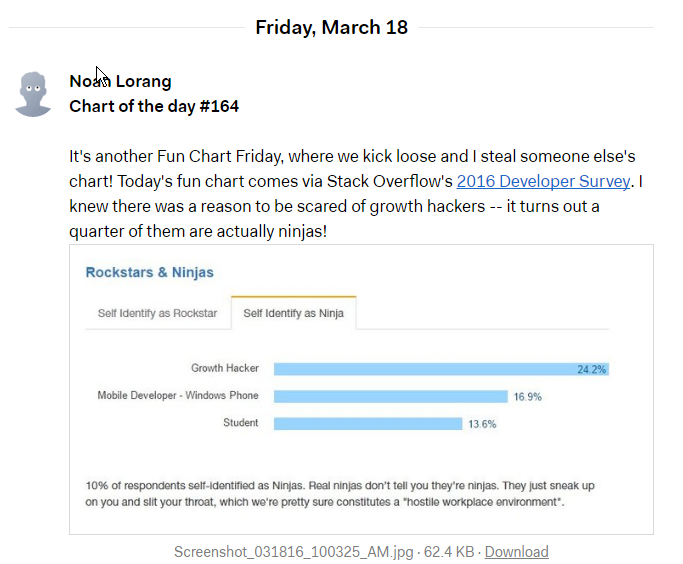
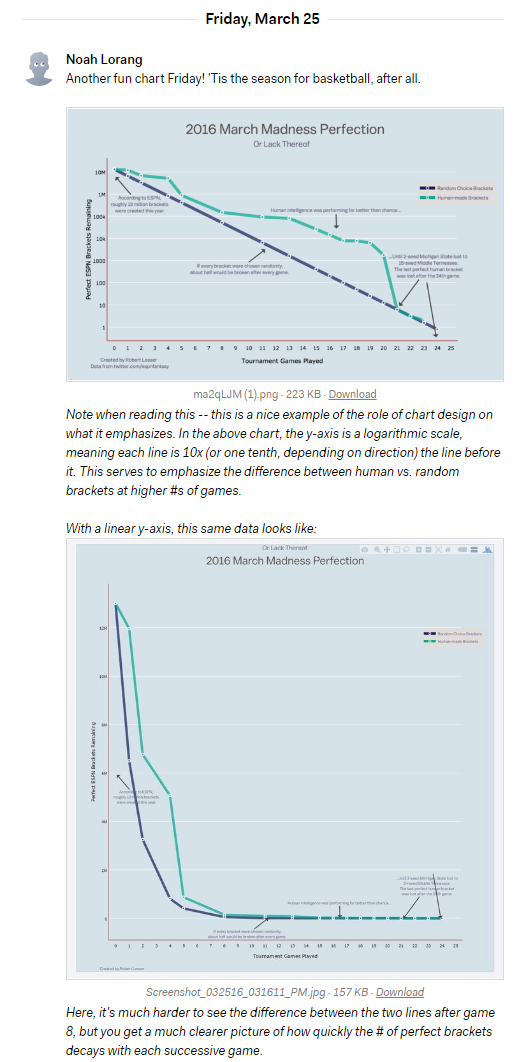
On most Fridays, rather than posting a “serious business” chart about Basecamp, I try for something a little lighter. Fun Chart Fridays are either charts about a less serious aspect of Basecamp (Campfire sounds are a perennial crowd pleaser) or something that I’ve seen elsewhere on the internet that’s interesting or amusing.
Sometimes they’re also a good chance to talk about a way of visualizing or thinking about data that’s a little different than the ordinary, or to contrast different looks at the same piece of data.
Inside the mind of a daily charter
Most days, charting is easy: I copy something from an analysis or report I’m working on and I paste it in Basecamp, write a sentence or two of explanation, and move on with my day.
Then there are days where charting is a real slog — I don’t have anything handy because I’ve been working on infrastructure, or I realize that the chart I was all set to post is actually too similar to something else I’ve posted, or I’m just tired. On those days, I sometimes question why I’m bothering. Does it really matter if I post a chart today? Or any day?
Eventually, I always convince myself that it does matter, because data can change the way people see things. People sometimes don’t even know the question they want to ask, which can make it hard for me to help them, but I can at least put a piece of data in front of them each day and hope that it sparks something in them that leads them to think about a problem a little differently. It sounds corny, but if that leads to us making a single better decision for our customers, that’s all the payback I need to make another chart.
A daily reminder that there are questions we can answer if we look at them the right way is pretty neat. — Jim
I’ve missed days because I’ve totally forgotten, and the chart of the day took a few weeks of summer vacation this year, but I’ve yet to just give up and not post on a day because I didn’t feel like it. That’s a small thing, but it gives me some satisfaction, and I’m going to keep on charting until they pry the x-axis out of my fingers.
These charts help us make Basecamp. You can use Basecamp for your daily charting habit too! If you do, let me know
Walk into any startup office and you’ll see almost the exact same thing: a bunch of big televisions showing real-time dashboards. Traffic, tweets, leads, sales, revenue, application performance, support cases, satisfaction, A/B test results, open rates; you name it, there’s a real-time dashboard for it.
Walk into Basecamp and you won’t see any of those, and it’s not just because we’re a remote company. It’s because real-time dashboards are often more harmful than they are beneficial.
[Gothamist] There’s something called Chartbeat — it shows you how many people are reading a specific article in any given moment, and how long they spend on that article. That’s called “engagement time.” We have a giant flatscreen on the wall that displays it, a lot of publications do.
[Caro] What you just said is the worst thing I ever heard. [Laughs]
What’s the point of that dashboard?
I do a lot of reporting: on operations, on support, on usage, on finances, on marketing, and on every other topic that matters to a business. Whenever I consider a new piece of reporting, I ask myself one question: what’s the point? What’s the action or decision that this reporting is intended to impact? When someone consumes it, what can they do about it? Can they make a decision? Can they go do something personally or ask someone to do something? If there’s nothing that can be done in response to a report, does it need to be reported in that manner?
Most real-time dashboards fail to pass this usefulness test. Knowing how many visitors you have on your site right now or what the open rate was for the email that just went out doesn’t generally enable you to do anything. In a SaaS business, knowing what today’s revenue is doesn’t really enable you to do anything either: revenue today is the consequence of a sales and retention cycle that started long ago.
There are cases where real-time dashboards are invaluable. Knowing whether database response time is higher right now than it was a few minutes ago is incredibly useful when your site is slow, and we use real-time dashboards extensively for solving availability and performance problems at Basecamp.
Schrödinger’s dashboard
Perhaps real-time dashboards aren’t that useful, but if they aren’t a lot of work to set up, what’s the harm? Isn’t faster data better data?
The problem comes when you look at a real-time dashboard: no matter how much you try to train yourself, you’re going to react to the data that you just saw. You might not realize that you’re reacting to it, but you absolutely are.
Almost every metric is noisy. Active users being down 3% from yesterday could be the start of a longer trend, but it’s much more likely that it’s just noise in the data. When you see that 3% decrease on a real-time dashboard, however, the panic starts to set in: what did we do wrong? Anything you were thinking about gets thrown out the window, because now you’re reacting to something that looks urgent, but really isn’t important.
I’ve seen many cases of people looking at real-time A/B test results and judging the experiment after an hour or two. No matter how much labeling you do to point out that the results are meaningless at that scale, humans will still draw conclusions from them. In our case, and for virtually every online business, daily updated results are more than adequate for making decisions, so there’s only downside to real-time A/B test results: the risk of making a decision off insufficient data and that decision turning out to be the wrong one.
We recently scaled back and de-emphasized the use of a bunch of metrics relating to our support team. We found that a focus on average customer happiness scores, response time, and case volume made it hard to give each individual customer the attention they deserved, and caused a ton of unnecessary stress. Kristin explained our motivation well:
We’re attempting to change our relationship with Smiley and metrics so that our focus is more on each individual customer and less on any sense of competition with ourselves and/or each other. Smiley leads us to focus on the vocal minority (about 20%) of customers who leave a rating. The customer we’re currently working with should have 100% of our attention, so we shouldn’t be worried about quickly getting rid of them to move on to the next one or focusing on the customer as a potential Smile instead of as a person who needs help.
The next time you feel the urge to look at Smiley and/or Dash, get up and take a break. Make some tea. Eat some cheese popcorn. Pet an animal. Stretch.
I’m really proud of the support team for their evolving relationship with the use of metrics. We got a lot of value out of rigorously analyzing our support caseload to figure out the right level of staffing, scheduling, and address root causes, but we can do all of those things without real-time reporting. Knowing when not to look at a piece of data is just as important as knowing when to look.
Make reporting great again
How can you make reporting less stressful and more useful? Try a few of these simple changes:
Change the timeframe. Instead of looking at the last day of data, look at the last week or month. Maybe there’s a bigger seasonal trend that will help to contextualize today’s data.
Move upstream. Instead of reporting something like daily revenue, which is the output of every step of your funnel, report on the actual underlying drivers that you can impact.
Contextualize. Instead of showing an absolute metric, show a percentage change or a comparison to last week or last month.
Convert dashboards to alerts. Computers are great at sending emails according to defined conditions, so let them do that. Don’t rely on checking a real-time dashboard to detect that something isn’t right; define your criteria and let an automated system tell you when you need to take a deeper look.
I get it: real-time reporting is fun. It’s something shiny to put up in your lobby, and it fills you with lots of little bits of trivia to drop at a moment’s notice. But that comes at a cost, and too many people embrace real-time reporting without thinking through the consequences.
A paean to slow data
Eschewing real-time dashboards is just one part of what I like to call a “slow data” approach to data science. I’m not talking about free-range histograms or artisinal Poisson distributions, but about taking the time to really understand the problem you’re solving, the data you’re using, and the implications of the results. My profession spends most of its time talking about statistical methods and visualization, and very little time talking about the actual business problems or impacts of the work. Fortunately, I mostly just do arithmetic, make very simple charts, and avoid making real-time dashboards, so I have lots of time to think about the problem we’re trying to solve.
I’d encourage you to give this slower approach to data science a shot in your organization too. Next time you think about making a real-time dashboard, ask a deeper question about the underlying problem instead. I guarantee you’ll find more value from that.
We’re excited to be running our largest summer internship program ever at Basecamp. We have an exceptional and diverse class of eleven interns who will be joining us for the summer, and couldn’t be more thrilled to have them.
The process of hiring our interns ended up being one of the hardest and most enjoyable experiences of my professional career. I want to share a little bit about how we approached it, what we learned, and some advice for future interns candidates and internship coordinators.
Why even have an intern program?
There are three compelling reasons for Basecamp to offer internships:
Give back and have an impact on the community — We all started somewhere, and for many of us, internship or early employment opportunities dramatically impacted the course of our careers. This is our chance to give that opportunity to the next generation of developers, designers, etc., just like someone did for us all those years ago. In addition, the Basecamp perspective on product development, programming, and even data science is no doubt quite a bit different from what is commonly taught in schools. Internships give students an opportunity to see how things are done in the “real world,” and for us to impact the way future industry leaders think about problems at a formative point in their development.
Challenge ourselves to grow — As a company, we have limited experience bringing people up to speed quickly, particularly at the entry level; most of the people we hire are mid-career, and we screen heavily for managers of one. Internships present a unique challenge for us: How do you take someone with little or no industry experience, teach them practical and critical thinking skills, and help them get to a completed project in two or three months? I think there are real opportunities to learn from that experience in terms of how we onboard, communicate values and approaches, structure projects, share feedback, etc., and we’ll see those benefits pay back long after the interns have left us.
Improve Basecamp (the product and company) — We’ve had past interns have an incredible impact on Basecamp, both in terms of bringing new ideas and doing high-quality, important work on the product. While I personally think an internship program would be a success and worth doing even if we only hit reasons #1 and #2, the icing on the cake is the great impact that interns can end up having in their actual work.
What were we looking for?
We structured our internship program a little differently than most do, in a couple of important ways:
Rather than hire interns generically for a department, we chose to structure the program around concrete projects with a specific mentor. These projects were all real projects that we want done at Basecamp, and they’re the interns to own for the summer.
We’re a remote company, so we hired remote interns. While we’ve had interns in the past, they’ve actually always been in Chicago — this is our first time running a remote internship program.
We were looking for interns in programming, design, operations, marketing, and data, so there’s no technical skills profile common to all of the positions. What was common was our desire to have an impact on interns at an early moment in their career and to see them go on to great things in the future. Here’s what I wrote to the team as we started evaluating intern candidates:
The biggest thing we’re looking for in interns is potential. We don’t expect interns to be as capable as a full time employee, and we expect that they’ll learn things along the way, so what we’re really looking for is someone who we think will develop into a great programmer, designer, marketeer, analyst, etc. with some guidance and support.
The process we used
The process of hiring our interns stretched from late December until the end of March, including finalizing projects, advertising the program, screening applications, and a couple rounds of interviews. Here’s how we did it.
Getting the word out
We advertised on our website, We Work Remotely, Signal v. Noise, Twitter, Facebook, and a variety of college and other job boards. The application process for interns was simple: send us an email explaining why you want to be an intern at Basecamp, what projects you’re interested in working on, what work you’ve done in the past, and why we should hire you. Include a resume if you’d like, but it’s not required — we care far more about great cover letters. We set a deadline for application about six weeks after we started advertising the program.
Initial application screening
We received 646 email applications, including over 200 in the final week of the application period. Each application was loaded into a Basecamp project for review by at least two team members, looking for pretty basic stuff — is there any potential that this person could be a viable intern candidate at Basecamp? Are they actually applying for the job? Do they have any relevant background? Can they communicate clearly? Did they follow the basics of the application instructions?
After reviewing an application, each reviewer gave a simple yes or no recommendation on proceeding with their candidacy. One “yes” from a Basecamper got an applicant through to the next round, or two rejections eliminated them from consideration. Eight different Basecamp staff members dedicated time to reviewing applications, ranging from a dozen to hundreds of applications each.
Phone screen
After reviewing all of the applications, we invited 114 candidates (about 18% of the total application pool) to schedule a brief 20-minute phone call with someone at Basecamp, and we were able to successfully connect with 100 people (some had already accepted other internship offers or never replied to our invitation).
These calls were intended to give us an opportunity to get to know candidates, better understand their motivation and skills, and give them a chance to ask us any questions. Several of us conducted these interviews, and while we all asked questions a little differently, the general rubric for these interviews went like:
Can you tell me a little about yourself?
Why are you interested in working at Basecamp? Why this project in particular?
What are you hoping to get out of the summer?
Can you tell me about a recent project that you worked on that you’re particularly proud of?
Do you have any concerns about working remotely?
Can you tell me about your experience with <various project specific technologies>?
Do you have any questions for me?
After each interview, the interviewer wrote up notes from the call about what was said, what their impressions were, and whether they’d recommend them for a specific project.
Final interviews with mentors
Following the phone screens, each mentor chose who they wanted to talk to further and set up video or phone interviews to ask project specific questions. I don’t have an exact count of how many of these we did, but we talked to roughly 30 candidates in this final stage. For some projects, candidates also had a further follow-up conversation with the rest of the team they’d be working with.
After interviewing all of the candidates they were interested in, mentors and their teams chose interns to make offers to, which we extended at the end of March. We also notified each candidate that wasn’t selected as quickly as we could.
We ended up hiring 11 interns for the summer: 9 for full summer-long projects and 2 interns who will be working on a handful of smaller projects during the summer.
Tips for prospective interns
After you review hundreds of applications, you start to see a few things that commonly occur in great applications, and a few things that are common in applications that aren’t so great. Ann, who reviewed most of the applications and conducted many of the screening interviews, wrote up a few of the things that stood out to her during the review process:
Follow the directions Following directions is such an important thing & I was amazed by how many people don’t get that. It was really simple for people because we didn’t ask for that much.
We wanted to know which internship people were interested in, along with a cover letter, and some info about their qualifications. You know us — we’re not sticklers for resumes. But we need to know why people think they’re qualified & what they want.
Communicate clearly If I wasn’t on board with the ‘hire good writers’ philosophy before, holy cow am I on board now. I didn’t need people to be funny, or to be super creative, or to have ✨pizzaz✨. I just needed them to articulate who they were, what they were interested in & what their qualifications are.
Tell us your qualifications Demonstrate why you’re qualified. Sounds like a no brainer, right? People applied for programming internships without showing us any projects they worked on, or even describing their experience in any depth. We’re not looking for fully formed apps — these are interns after all. Projects for classes are great. Bootcamp projects are great. Simple design portfolios are all we’re looking for.
Some folks told us about their hobbies. You’re a mountain biker? Great! How is that relevant to the marketing internship? You’re a mountain biker and you helped organize and promote a charity bike race via social media? Let’s talk!
Find the right tone Don’t send us a generic cover letter. “Dear recruiter” is a big tip off that you’re firing off applications without any thought. You want the gig? Make an effort.
We’re not formal by any means. Sending a Ha Ha Business! style cover letter & resume is an indication the applicant doesn’t know our working style.
Some people went the other direction & sent us applications that were really unprofessional. Don’t curse in an application. Yes, we curse on SvN. It’s still not ok to do in an application. Don’t tell us all the things your last employer did wrong & how you told them off for it. It doesn’t make you look edgy; it makes you look like a jerk & a gossip.
Make it easy for us Don’t waste my time. I’m not going to a site & filling out a form to give you more information about who your mentor would be. I’m not impressed by that.
Don’t name your resume file “Resume.pdf”. We’re looking at hundreds of resumes. Make it easy to find.
Spell the company’s name right. I don’t think this is too much to ask.
Tips for intern program coordinators
I’m not a human resources professional — I look at numbers for a living — and this is the first time I’ve organized an internship program. It was a great experience, and I particularly enjoyed the chance to talk to so many passionate people who are just getting started in the industry. It was also, candidly, a ton more work than I thought it would be, and filled with far more gut-wrenching decisions than I expected.
There are a few things I’ll be sure to do in the future:
Use an application management system
When I wrote up the application instructions, I figured we’d be lucky to get 100 applications, and it would be no problem to deal with them manually, so the application instructions were to email an alias that ended up in my inbox.
That was a mistake — we ended up getting nearly 650 applications, and I spent untold time copying-and-pasting applications and attachments into Basecamp to-dos, and later searching through my email to be able to let people know of our decisions. An application management system that is built around a defined workflow (directly receiving applications and from which you can send replies to candidates) would have made a big difference in my personal happiness throughout the process.
Do everything on a rolling basis
While our initial intention was to do things on a rolling basis and to start interviewing candidates as soon as applications came in, that isn’t what ended up happening. In part because I was spending so much time on the drudgery of manually processing applications, we didn’t start doing screening interviews until after the application deadline passed, and most mentors didn’t start doing their interviews until all the screening interviews had been completed.
This leads to two problems:
We didn’t get to talk to all of the candidates we wanted to because some of them had already accepted offers before we got around to asking them to interview.
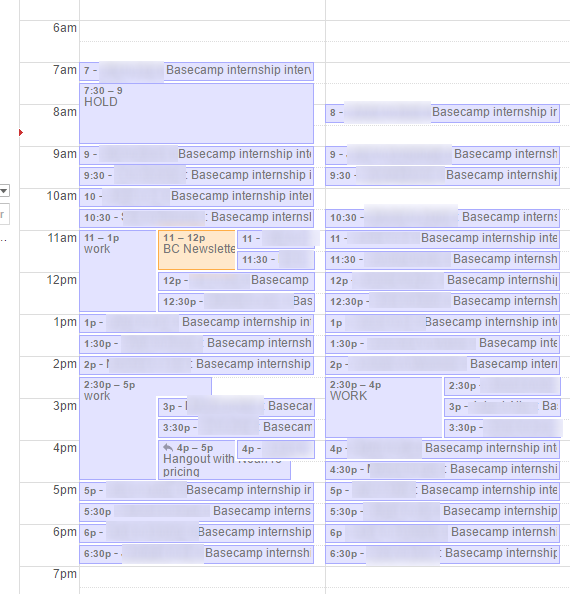
It led to some really draining days of back-to-back-to-back interviews. For example, here’s a couple days of my calendar from the peak of our screening interview season.
While I can confirm that it is physically possible to do that many interviews in a day, I wouldn’t recommend it.
Stay flexible
When we started the process, we were pretty set on only hiring interns for specific, full-summer-length projects with dedicated mentors. We care a lot about it being a great experience for interns, and we thought that was the best way to deliver on that goal.
As we went along, however, we met some candidates who were too good to pass up on, and we ended up with more people we wanted to hire than we had specific projects already lined up. We quickly figured out a solution:
It’s always a good reminder… When we set up the rules, we can change the rules. — Jason Fried
So we ended up hiring a couple more interns than we initially planned to, and we’re putting together a series of shorter projects for them that will have them working with a few different people during the summer. It’s a little different than we originally planned, but I have no regrets about being flexible in order to get to work with more great people.
Meet the 2016 Basecamp summer interns
I’m incredibly proud of the class of interns who will be joining us this summer, and I’m excited to work with all of them. There are 11 in total:
Basel Razouk is an engineering student from Strathclyde University in Glasgow and will be working on marketing this summer.
Blake Stoddard comes to us from North Carolina State University. He’ll be working with the operations team this summer.
Dan Scott comes to us from Ireland, where he’s studying with Open University. He’ll be working with the Android team.
Danny Vilela is a student at NYU studying computer science. He’ll be working with me on data this summer.
Drew Rygh joins us from the University of Wisconsin to work on Trix this summer.
Edlyn Yuen is a banker-turned-VC-turned-entrepreneur who will be working on marketing.
Esther Lee is an experienced writer and teacher who will be joining us from Atlanta rotating through a couple of different programming related projects.
Ethan Eirinberg is heading to Stanford in the fall, but will first spend the summer working with us on a design project.
Justin White is a recent graduate from DePaul University (and was previously a student at our former neighbors, Starter League). He’ll be working with us as a programmer working on our internal tooling.
Michelle Harjani hails from Vancouver and will be doing a rotation through a handful of design projects this summer.
Nathan Petts just finished his master’s degree in human-centered design and will be joining us from Chicago to work with us on a project related to how people work with clients in Basecamp.
We’ve asked each of the interns to write up what they did during the summer, so keep your eyes on Signal v. Noise in the future to learn more about their time here.
When I wrote about how I mostly just use arithmetic, a lot of people asked me about what skills or tools a data scientist needs if not fancy algorithms. What is this mythical “basic math” that I mentioned? Here’s my take on what skills are actually needed for the sort of work that I do at Basecamp: simple analyses focused on solving actual business problems.
The most important skill: being able to understand the business and the problem
I’ll get to actual practical skills that you can learn in a textbook in a minute, but first I have to belabor one point: the real essential skill of a data scientist is the ability to understand the business and the problem, and the intellectual curiosity to want to do so. What are you actually trying to achieve as a business? Who are your customers? When are you selling your product? What are the underlying economics of the business? Are profit margins high or modest? Do you have many small customers or a few large customers? How wide is your product range? Who are you competing with? What challenge is the business facing that you’re trying to solve or provide input towards a decision on? What’s the believable range of answers? Who is involved in solving this problem? Can analysis actually make a difference? How much time is worth investing in this problem?
Understanding the data
Before you look at any data or do any math, a data scientist needs to understand the underlying data sources, structure, and meaning. Even if someone else goes out and gets the data from wherever it’s stored and gives it to you, you still need to understand the origin and what each part of the data means. Data quality varies dramatically across and within organizations; in some cases you’ll have a well documented data dictionary, and in other cases you’ll have nothing. Regardless, you’ll want to be able to answer the following questions:
What data do I need to solve the problem?
Where is that data located? In a relational database? In a log file on disk? In a third party service?
How comprehensive (time and scope) is the data? Are there gaps in coverage or retention?
What does each field in the data mean in terms of actual behavior of humans or computers?
How accurate is each field in the data? Does it come from something that’s directly observed, self-reported, third-party sourced, or imputed?
How can I use this data in a way that minimizes the risk of violating someone’s privacy?
SQL skills
For better or worse, most of the data that data scientists need live in relational databases that quack SQL, whether that’s MySQL, Postgres, Hive, Impala, Redshift, BigQuery, Teradata, Oracle, or something else. Your mission is to free the data from the confines of that relational database without crashing the database instance, pulling more or less data than you need to, getting inaccurate data, or waiting a year for a query to finish.
Virtually every query a data scientist writes to get data to analyze to solve business problems will be a SELECT statement. The essential SQL concepts and functions that I find necessary are:
DESCRIBE and EXPLAIN
WHERE clauses, including IN (…)
GROUP BY
Joins, mostly left and inner
Using already indexed fields
LIMIT and OFFSET
LIKE and REGEXP
if()
String manipulation, primarily left() and lower()
Date manipulation: date_add, datediff, to and from UNIX timestamps, time component extraction
regexp_extract (if you’re lucky to use a database that supports it) or substring_index (if you’re less lucky)
Subqueries
Basic math skills
Once you have some data, you can do some maths. The list of what I consider to be the essential list of math skills and concepts is not a long one:
Percentages (of total, difference vs. another value)
Mean and median (and mean vs. median)
Percentiles
Histograms and cumulative distribution functions
An understanding of probability, randomness, and sampling
Growth rates (simple and compound)
Power analysis (for proportions and means)
Significance testing (for proportions and means)
This isn’t a very complicated set of things. It’s not about the math, it’s about the problem you’re solving.
Slightly more advanced math concepts
On occasion, some more advanced mathematical or SQL concepts or skills are of value to common business problems. A handful of the more common things I use include:
Analytic functions if supported by your database (lead(), lag(), rank(), etc.)
Present and future value and discount rates
Survival analysis
Linear and logistic regression
Bag of Words textual representations
There are some problems that require more advanced techniques, and I don’t mean to disparage or dismiss those. If your business can truly benefit from things like deep learning, congratulations! That probably means you’ve solved all the easy problems that your business is facing.
Hi, I’m Noah. I work at Basecamp. Sometimes I’m called a “data scientist.” Mostly, I just do arithmetic, and I’m ok with that.
Here’s a few of the things I worked on in the last couple of weeks, each of them in response to a real problem facing the business:
I analyzed conversion, trial completion, and average invoice amounts for users in different countries.
I identified the rate at which people accidentally sign up for Basecamp when they mean to sign in to an existing account and how that’s changed over time.
I analyzed and reported on financial performance of a few of our products.
I ran and analyzed a survey of account owners.
I analyzed an A/B test we ran that affected the behavior of a feature within Basecamp.
In the last two weeks, the most “sophisticated” math I’ve done has been a few power analyses and significance tests. Mostly what I’ve done is write SQL queries to get data, performed basic arithmetic on that data (computing differences, percentiles, etc.), graphed the results, and wrote paragraphs of explanation or recommendation.
I haven’t coded up any algorithms, built any recommendation engines, deployed a deep learning system, or built a neural net.
Why not? Because Basecamp doesn’t need those things right now.
The dirty little secret of the ongoing “data science” boom is that most of what people talk about as being data science isn’t what businesses actually need. Businesses need accurate and actionable information to help them make decisions about how they spend their time and resources. There is a very small subset of business problems that are best solved by machine learning; most of them just need good data and an understanding of what it means that is best gained using simple methods.
Some people will argue that what I’ve described as being valuable isn’t “data science”, but is instead just “business intelligence” or “data analytics”. I can’t argue with that arbitrary definition of data science, but it doesn’t matter what you call it — it’s still the most valuable way for most people who work with data to spend their time.
I get a fair number of emails from people who want to get into “data science” asking for advice. Should they get a masters degree? Should they do a bunch of Kaggle competitions?
My advice is simple: no. What you should probably do is make sure you understand how to do basic math, know how to write a basic SQL query, and understand how a business works and what it needs to succeed. If you want to be a valuable contributor to a business, instead of spending your weekend working on a data mining competition, go work in a small business. Talk to customers. Watch what products sell and which ones don’t. Think about the economics that drive the business and how you can help it succeed more.
Knowing what matters is the real key to being an effective data scientist.
Basecamp is looking for talented interns to join our team this summer. We’re excited to work with you, and the things you work on will impact millions of users at the world’s leading online project management tool.
About the Basecamp summer internship program
Interns at Basecamp work on real projects and are mentored one-on-one by a member of our team who will guide you throughout your time at Basecamp. The projects you’ll work on as an intern at Basecamp are all derived from real problems we face as a business, and we expect you’ll have a meaningful impact during your time here. You’ll leave Basecamp with new technical, creative, and business skills and having accomplished something significant.
Internships at Basecamp are remote — you can work from anywhere you want, provided there’s some overlap in time zones with your assigned mentor. We’ll fly you to Chicago once or twice during the summer to get together with your mentor and the rest of the intern class, and you’ll talk regularly with your mentor via phone, Skype, or Google Hangouts. You’ll also participate in some of our dozens of Campfire chat rooms every day.
All internships are paid and require a commitment of 8–12 weeks of full time work between May and August 2016 (we’re flexible on start/end dates, planned vacations, etc.).
About you
We’re hiring interns interested in working on programming, product design, operations, marketing, and data.
Regardless of role, there are a few key things we’re looking for in interns:
You are independent and self-driven. Basecamp is built on the concept of being a team of managers of one, and that applies to interns as well. You’ll get plenty of support and guidance from your mentor and the rest of the team, but no one will be telling you how to spend each minute of your day, so it’ll be up to you to make sure you’re making forward progress.
You are an excellent communicator. We write a lot at Basecamp — we write for our products, we write for our marketing sites and initiatives, and most importantly, we write as our primary way of communicating internally. Clear and effective communication is essential to being successful at Basecamp.
You have fresh ideas and you’re willing to share them. We don’t know it all, and we actively want to hear fresh ideas and perspectives that we haven’t considered.
You’re eager to learn. You’ll dive right in to new technologies, new approaches, and new concepts and apply them to your work.
How to apply
To apply, send an email to [email protected] explaining why you want to be an intern at Basecamp, what projects you’re interested in working on (see below), what work you’ve done in the past, and why we should hire you. Feel free to include your resume, but we’re big fans of great cover letters over resumes. Be sure to tell us what dates you’re available this summer and where you’ll be located.
We’ll be accepting applications through Wednesday, February 24th. We’ll be in touch to confirm receipt of your application and let you know about next steps shortly after we receive your email.
The projects
As an intern at Basecamp, you’ll work on one of the following projects directly with a mentor.
Programming: Research and implement new features for Trix, our open-source rich text editor (JavaScript / CoffeeScript) and integrate those features in Basecamp 3.
Programming: Make our Android app more Androidy. Taking into consideration the foundation of our hybrid (web + native) app development philosophy, our Android team will help you explore ways to make uniquely powerful Android features — ones that make our customers reach for their Android device instead of the desktop app.
Programming: Change the way people find information internally at Basecamp by unifying various internal search tools into a single source of all the information people need to respond to customer problems. You’ll talk to internal clients, survey the state of the world, and then build out a solution.
Design: Understand how people work with clients in Basecamp through a mix of quantitative analysis and customer research (surveys, structured interviews). You’ll work to structure the problem, identify the data that you need, write survey questions and interview guides, conduct interviews, and synthesize findings and implications for client features within Basecamp.
Marketing: Help us target a specific industry (or “vertical”) by picking an industry, identifying the various stakeholders who are involved, interviewing them, and building out a sample Basecamp to demonstrate how Basecamp can help them accomplish their work. You’ll launch your work and then measure the impact of that work on the targeted vertical.
Marketing: Identify what people are saying about us on social media by using your analytical and digital marketing skills to help determine both quantitative and qualitative ways for us to know what people are saying about Basecamp. Are they generally happy? Satisfied? What are they talking about? How can we measure our impact?
Operations: Bring us into the IPv6 age by coming up with a plan for us to add IPv6 support to our public sites, testing support, deploying the new configuration, and providing documentation and training for our operations and support teams.
Operations: Establish a way of offering custom domains for Basecamp 3 customers. You’ll figure out how to automate provisioning, handle terminating thousands of SSL certificates, monitor for problems, and make it a great customer experience.
Operations: Upgrade our hardware provisioning process so we have a fully automated process to take a server from the point of arriving at our datacenter to being production ready.
Operations: Make it easy for new people to come on board or set up a new computer by figuring out how to run everything you need for development in a virtual machine or container.
Data: Help us find problems before we feel the pain of them by improving our ability to identify unusual values in the over 30,000 services we monitor to tell us about the health of our applications and businesses. You’ll identify the right algorithms to use to detect aberrations, the parameters needed to ensure that we balance false positive and false negative alert rates, and put the system into production.